- 您现在的位置:买卖IC网 > Sheet目录323 > DSTRM-KT-0181A (Keil)DSTREAM DEBUG AND TRACE UNIT
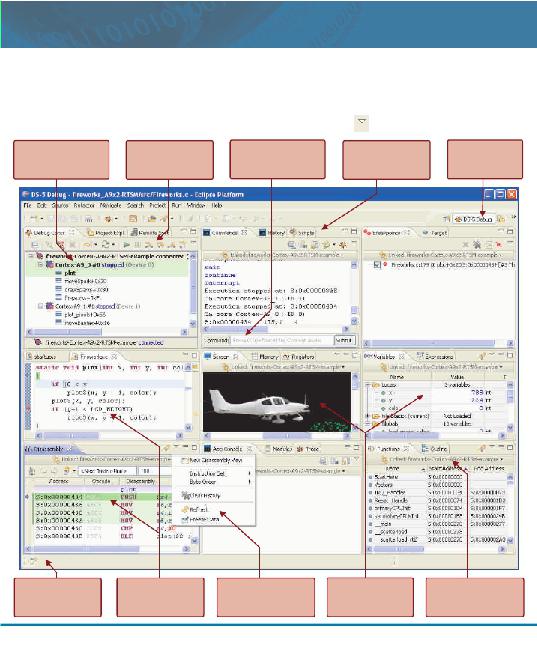
DS-5 Debug Perspective
DS-5 includes a fully featured graphical C/C++ debugger.
Open it by launching the debugger from the Debug
Configurations dialog, or by clicking Window ? Open
Perspective ? Other... ? DS-5 Debug .
Alternatively, the debugger can be used from the host’s
Each debug view is self-contained, so there is no need to
configure any options using the Eclipse main menu. Note
that some of the debugger views, for example the Trace view,
are only enabled for JTAG target connections.
Take time to explore the toolbars of each of the views. Press
command line interface, or from a Jython script .
the down arrows
to see more buttons and options.
Click to focus the system
views on a connection,
core, thread or stack frame
Fast View bar for
minimizing often-used
debug views
Control target execution
with source and assembly
level stepping
Source and assembly
code views synchronized
with color coding
Type GDB-style commands
with auto-completion
and on-line help
Click the down arrow to
access the sub-menu, and to
freeze and replicate views
Drag & drop lines from
history view to scripts
view to create a script
Screen buffer and system
views have multiple
formatting options
Switch between the
C/C++ and DS-5
Debug perspectives
Link the view to the active
connection, or to a fixed
connection or processor
www.arm.com/ds5
7
发布紧急采购,3分钟左右您将得到回复。
相关PDF资料
DSUT1CSU
SURGE SUPPR NETWORK W/GROUND
DTEL2
SURGE SUPPRESSOR PHONE RJ11/RJ45
DV003001
PROGRAMMER PICSTART PLUS 16C/17C
DV164035
MPLAB ICD3 IN-CIRC DEBUGGER
DV164039
KIT DEV PIC24FJ256DA210
DV164101
KIT DEV PICKIT1 FLASH 8/14PIN
DV164120
KIT STARTER PICKIT 2
DV164121
KIT PICKIT 2 DEBUG EXPRESS
相关代理商/技术参数
DST-SSS-R1
制造商:DOMINANT 制造商全称:DOMINANT Semiconductors 功能描述:Right Angle LED
DST-SSS-R2
制造商:DOMINANT 制造商全称:DOMINANT Semiconductors 功能描述:Right Angle LED
DST-SSS-RS2-1
制造商:DOMINANT 制造商全称:DOMINANT Semiconductors 功能描述:Right Angle LED
DST-SSS-S1
制造商:DOMINANT 制造商全称:DOMINANT Semiconductors 功能描述:Right Angle LED
DST-SSS-S2
制造商:DOMINANT 制造商全称:DOMINANT Semiconductors 功能描述:Right Angle LED
DST-SSS-T1
制造商:DOMINANT 制造商全称:DOMINANT Semiconductors 功能描述:Right Angle LED
DST-SSS-T2
制造商:DOMINANT 制造商全称:DOMINANT Semiconductors 功能描述:Right Angle LED
DST-SSS-TU1-1
制造商:DOMINANT 制造商全称:DOMINANT Semiconductors 功能描述:Right Angle LED
